08/10/2026, F. Draux Actualité
22/06/2026 Formation Formation Competence-Center CC-FR
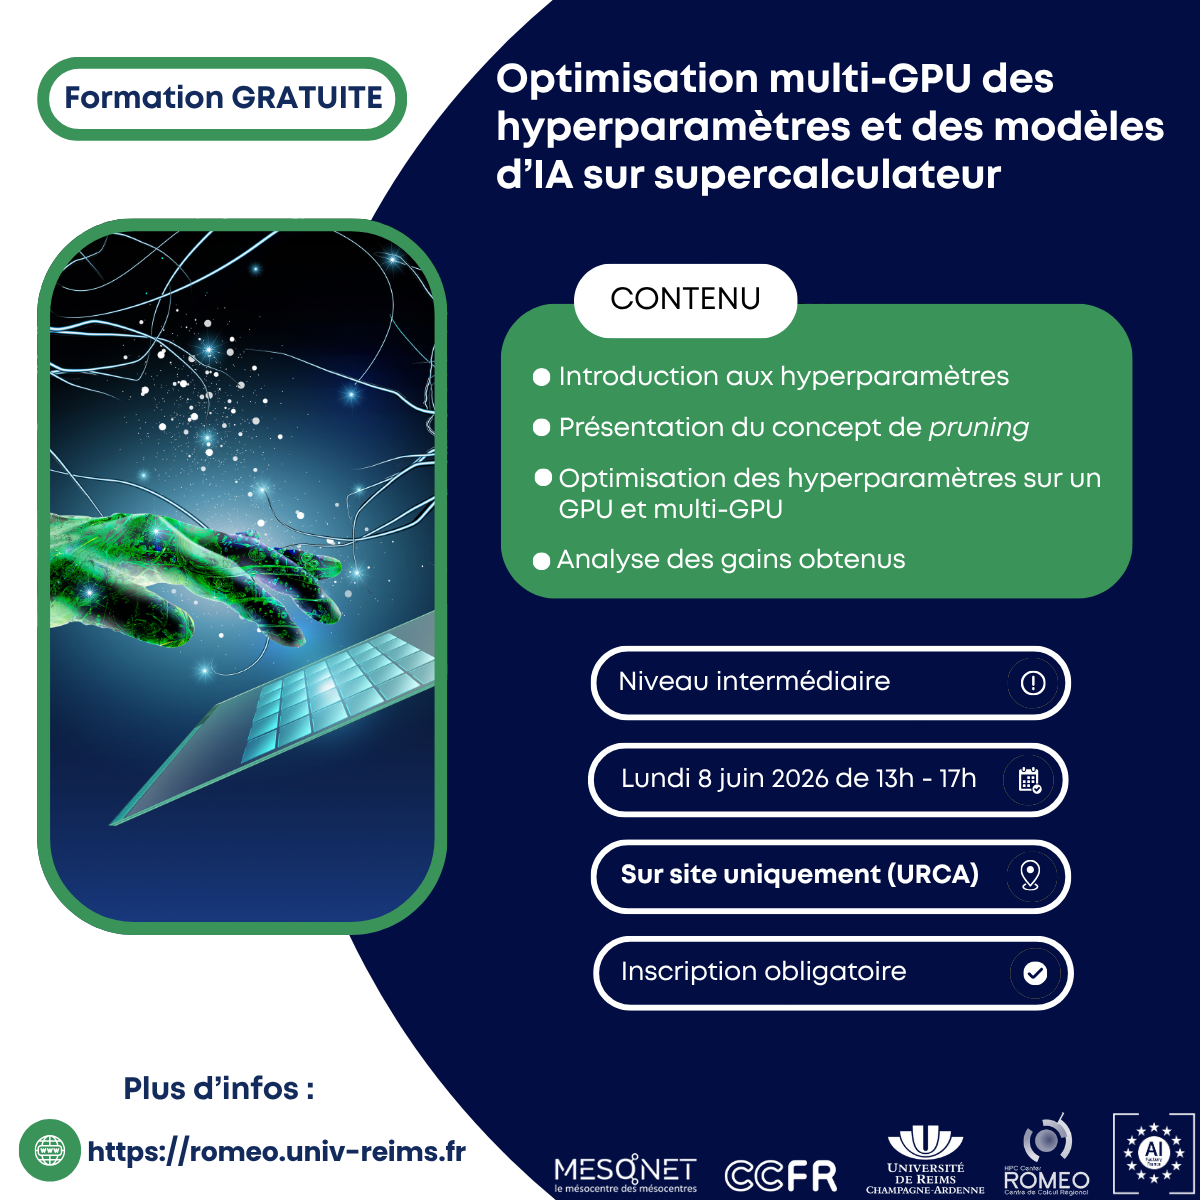
08/06/2026 Formation
04/06/2026, A. Renard, F. Mauguière Actualité
04/06/2026 Recrutement
03/06/2026 Recrutement